Measuring Performance
In this chapter you’ll learn about:
- The importance of using milliseconds in game development
- Converting ms to frames per second
- Basic tools for measuring performance
- Displaying statistics for each subsystem, like occlusion culling or particles
- Recording performance metrics and reading them with a profiler
If you prefer a video version of this lesson, you can watch it on YouTube.
Note: Every chapter of this book is extended compared with the original video. It’s also regularly updated, while videos stay unchanged since their upload.
Are frames per second the ultimate metric?
In hardware reviews, competing products are compared by running benchmarks based on the same games. The results are expressed in frames per second. Graphics card A is supposed to outperform B, because it produces twice as many frames in the same period of time. Game C is more demanding than D, because the same hardware is able to calculate only 40 frames each second compared to 60 in the other title.
Frames per second seem to be the most popular metric for performance. So why do game developers measure in milliseconds instead?
Here’s a quote from an article about NVidia HairWorks1:
As you might expect from a technology that is said to render tens of thousands of tessellated strands of hair, the performance hit to the game is substantial - whether you are running an Nvidia or AMD graphics card. In our test case, the GTX 970 lost 24 per cent of its performance when HairWorks was enabled, dropping from an average of 51.9fps to 39.4fps. However, AMD suffers an even larger hit, losing around 47 per cent of its average frame-rate - its 49.6fps metric slashed to just 26.3fps.
The conclusion we can draw from these numbers is that enabling HairWorks-simulated hair in Witcher 3 can make the game lose up to 23 frames per second, depending on the card. But let’s assume we have another feature, with an identical computational cost – for example Depth of Field. We enable both hair and DoF at the same time. Can we calculate final fps from this information, without using milliseconds?
Let’s try subtracting these costs from the original frame rate.
49.6 fps - 23 fps (HW) - 23 fps (DoF) = 3.6 fps?
Now what if there was a third feature of such high requirements, let’s say, HBAO? What we should end up with is:
49.6 fps - 23 fps (HW) - 23 fps (DoF)- 23 fps (HBAO) = -19.4 fps?
This apparent paradox of negative frame rate arises from the fact that we didn’t compare costs here, even if this was our intention. The actual cost of using these features was a period of time, not a number of frames. Our calculations were wrong.
Calculating feature costs with milliseconds
Let’s try milliseconds. Running the game without additional features allowed to complete about 50 frames in a second on average. How do we get the cost of each frame in milliseconds?
There are 1000 milliseconds (ms) in a second. If the game was able to finish 50 frames during 1000 ms, it means that an average frame took 1000/50 = 20 ms to render.
After enabling HairWorks, the game produced 26 frames per second. That shows us that the time cost of a single frame rose to 1000/26 = 38.5 ms.
Now we’re working with actual time periods, which can be added to one another. The feature added 18.5 ms to the time it took to produce a frame. After enabling three features, we end up with:
20 ms + 18.5 ms (HW) + 18.5 ms (DoF) + 18.5 ms (HBAO) = 75.5 ms
Enabling two more features lead to 75.5 ms per frame. This means the game was running at about 13 fps.
Common fps rates in milliseconds
It’s useful to memorize these three frame duration values - for 30, 60 and 90 fps:
Time in milliseconds = 1000 ms / frames per second
- 30 FPS = 1000 / 30 = 33.33 ms
- 60 FPS = 1000 / 60 = 16.67 ms
- 90 FPS = 1000 / 90 = 11.11 ms
These represent common expected refresh rates for various game categories: a “cinematic” adventure (30 fps), a fast-paced action game (60 fps) and a VR product (90 fps or more for reducing motion sickness). Each frame rate translates to a maximum time it should take to render a frame. If the software exceeds the time limit, it falls below the desired refresh rate (or even risks losing a V-Sync window).
Breakdown of a frame
The values above show us that every game has a certain limit of time per frame. It should never be exceeded. Otherwise the player will experience fps drops.
Aiming for 30 fps leaves the engine with over 33 ms to complete all gameplay code, audio code and graphics rendering. The work on graphics one is split between CPU and GPU(s). The CPU has a role of a “manager”, preparing data and sending commands to the GPU. The latter does the majority of calculations. The exact pipeline is explained in detail in “GPU and rendering pipelines”. They work (mostly) simultaneously, allowing the CPU to return to the gameplay code, while the GPU begins processing meshes and shaders. This means that the graphics card can use most of this 33 ms time window.
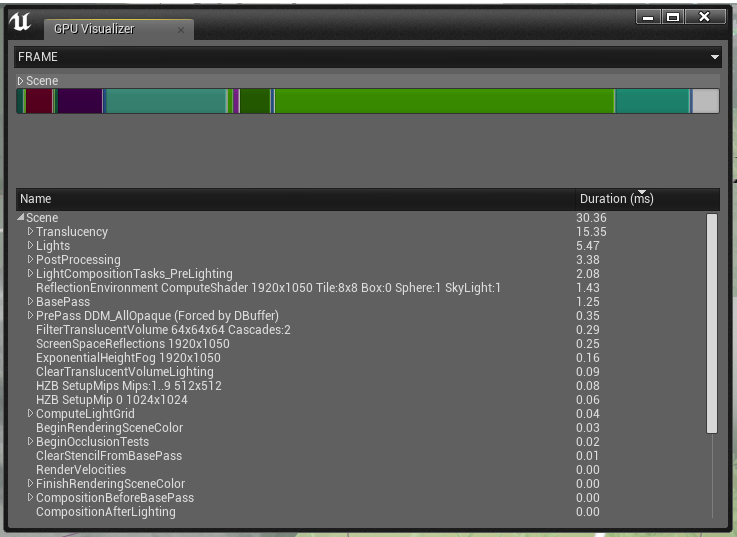
Following screenshots show the output of a tool built into Unreal, GPU Visualizer. It breaks down the work done by the GPU on a single frame into specific sections, like shadows or transparency. Several scenes were measured, each optimized for different refresh rates: 30, 60 and 90 fps.
The richness at 30 fps
The 30 fps scene can allow for many costly features to be used at once. It has a lot of transparency, heavy lighting (multiple dynamic light sources with big radius). In the right part of the colored bar, you can also see the post process using 3 ms.
Careful but fine at 60 fps
Now please take look at this graph. This scene has to render at 60 fps.
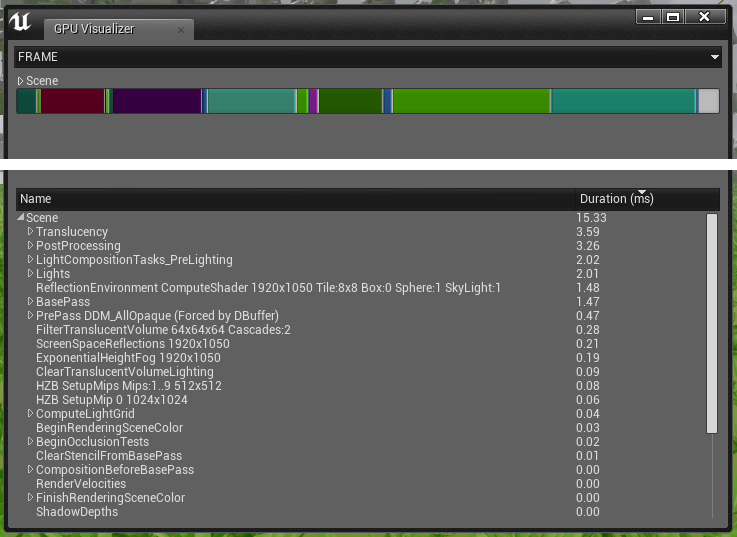
Now the engine has to fit in half of the time - 16.67 ms. The post process time didn’t change (because its cost is pixel-bound). So we still have a cost of 3 ms here – but now it’s a significantly bigger chunk of the time we can spare.
You can easily assume that by disabling the post process entirely we’ll end up with 12 ms per frame. But it still won’t be enough to land at the target of 11 ms – the 90 fps recommended for a VR kit like Oculus or Vive.
The harsh austerity of 90 fps
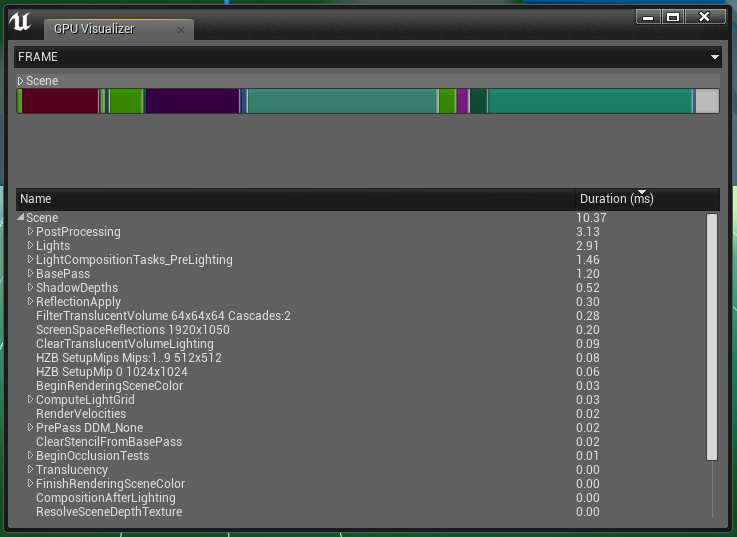
This scene could run with a VR kit. As you can see, even if the cost of post process is static, now at 11 ms it’s much more significant (compared to other passes). It was necessary to remove all translucent materials and particle effects. These cuts allowed to do full post processing and still keep a decent number of lights.
Each rendering pass has a certain cost that depends on the scene’s content. It’s up to us to balance the content and settings to reach a desired frame rate. As we’ve seen in this chapter, measuring in milliseconds allows us to do math pretty easily. The time it takes to render a frame is just a sum of its ingredients.
Console commands for diagnostics
Now that we know how milliseconds can be useful, we can proceed to actually measure something. There’s a multitude of commands to enter in a game or the editor. They can show frame times, object and texture statistics, memory usage and even record the data into a file for later inspection.
Disabling “Smooth Framerate”
Before we begin, to measure all this accurately, we have to stop Unreal from snapping the frame rate to stable values like 30, 45, 60 fps.
Go to Project Settings → General Settings → Framerate → and disable Smooth Frame Rate. The Smooth Frame Rate option tries to avoid momentary spikes in frame rate. It’s good for end user’s experience, so you can enable it again for the final game. But now let’s disable it to get precise measurements.
Entering commands
The basic console commands are entered by pressing [~] (tilde) in the viewport window or in a standalone development build.
The key [~] is located on the left from key [1] on keyboard. Use it and then type the command, for example: stat fps or stat unitgraph. The case of letters doesn’t matter. Then press Enter.
To toggle the command (e.g. hide the information it shows), just use the command again.
Stat FPS and Stat Unit
Stat fps shows us both the final number of fps and the time it took to render the last frame. It’s the total time. But we still don’t know if the cost was caused by the CPU or the GPU. As explained before, one has to wait for the other. Fast rendering on the graphics card won’t help, if the CPU needs more time to finish the work on gameplay, drawing (managing the GPU) or physics.
We can get more specific info by using the stat unit command. The time of a last frame is shown as 4 numbers.

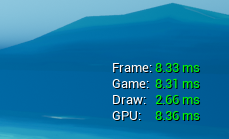
- Frame is the same as FPS, the final cost.
- Game is the work of the CPU on the gameplay code.
- Draw is the work of the CPU on preparing data for the graphics card.
- GPU is the raw time it took to render a frame on the graphics card.
Work on the next frame can’t begin until the current frame is finished and displayed. If one of the components takes more time than others, causing Frame to exceed the desired limit, it becomes a bottleneck2.
Stat UnitGraph
Stat unitgraph prints the same information, but also starts displaying a graph. It’s useful when moving or flying through the scene, because it makes it easier to locate heaviest places or situations. The drop in frame rate will be clearly visible.
Stat GPU
Stat GPU splits the time of rendering a frame into specific passes. It’s like a simplified, text version of GPU Visualizer (the graphical tool invoked with Ctrl Shift ,). The chapter about passes explains the meaning of each pass, along with tips for optimization.
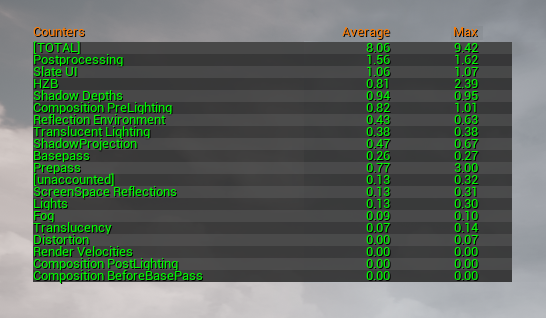
stat gpu, showing the cost of rendering passes.
Warning: If you’re getting an empty window from stat gpu on an older NVidia card, you’ll have to use a workaround.
Open C:\Program Files\Epic Games\your-version\Engine\Config\ConsoleVariables.ini. Then go to the end of the file and add these 2 lines:
r.NVIDIATimestampWorkaround=0
r.gpustatsenabled=1
Probably there’s a reason why Epic Games disabled it on older cards. Maybe it can lead to stability issues. If you want to use the workaround, please remember that you’re doing it at your own risk.
Stat InitViews
It helps with measuring the cost and effectiveness of occlusion and frustum culling. Both of them are techniques used by game engines to improve performance. They dynamically hide meshes that would be invisible from the camera’s position anyway. Contents of this stat output, as well as the culling itself, are discussed thoroughly in an article by Tim Hobson.
- View Visibility, Occlusion Cull. Cost of performing culling.
- Processed primitives. All objects that were considered, before culling.
- Frustum Culled primitives. Object that were out of camera’s cone of view.
- Occluded primitives. Objects concealed from camera’s view by other bigger objects.
Stat RHI
RHI in stat RHI stands for Rendering Hardware Interface3. This command displays several unique statistics:
- Render target memory. Shows the total weight of render targets like the GBuffer (which stores the final information about lighting and materials) or shadow maps. Buffers’ size depends on game’s rendering resolution, while shadows are controlled by shadow quality settings. It’s useful to check this value periodically on systems with various amounts of video RAM, then adjust your project’s quality presets accordingly.
- Triangles drawn. This is the final number of triangles. It’s after frustum and occlusion culling. It may seem too big compared to your meshes’ polycount. It’s because the real number includes shadows (that “copy” meshes to draw shadow maps) and tessellation. In the editor it’s also affected by selection.
- DrawPrimitive calls. Draw calls can be a serious bottleneck in DirectX 11 and OpenGL programs4. They are the commands issued by the CPU for the GPU and, unfortunately, they have to be translated by the driver5. This line in
stat RHIshows the amount of draw calls issued in current frame (excluding only the Slate UI). This is the total value, so besides geometry (usually the biggest number) it also includes decals, shadows, translucent lighting volumes, post processing and more.
Other stat commands
These stat commands can also be very useful:
stat Foliage. Stats related to all instanced static meshes (not only foliage). Shows number of instances and total triangle count.stat Landscape. Number of triangles and draw calls used to render all landscape actors.stat Particles. Number of particle sprites, among other info.stat LightRendering. Cost of lighting, number of lights affecting translucency lighting grid, shadow-casting and unshadowed lights.stat ShadowRendering. Cost of shadow casting. Total memory used by shadow maps.
Recording performance metrics
We can record all the metrics into a log. We’ll be able to analyze it later on a graph. Stat startfile is the command that starts recording the data6. A message pops up about log’s duration in the upper left corner. To finish recording, enter stat stopfile. Now exit the game, go to Window → Developer Tools → Session Frontend and load the latest file from your project\Saved\Profiling\UnrealStats\.
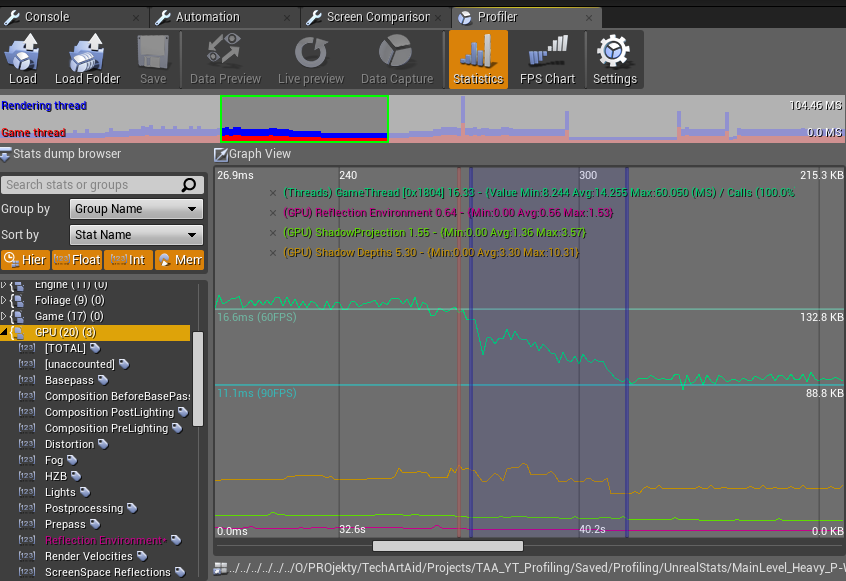
This is a profile of the GPU and the CPU at the same time. If we’re interested in graphics profiling, not gameplay, we should look for items in the “GPU” category in the sidebar. Double-clicking them will plot their values as new line on the graph. Horizontal lines shows targets for common fps values.
Footnotes
Footnotes for this chapter:
-
“Does Nvidia HairWorks really “sabotage” AMD Witcher 3 performance?”, Richard Leadbetter, eurogamer.net ↩
-
“High-Performance Games: Addressing Performance Bottlenecks with DirectX*, GPUs, and CPUs”, David Conger, intel.com ↩
-
Accepted answer to “What is RHI?”, Tim Sweeney, answers.unrealengine.com ↩
-
“What Exactly Is a Draw Call (and What Can It Do)?”, Scott Michaud, pcper.com ↩
-
Subchapter 1. “Many Draw Calls” in “Render Hell – Book III”, Simon Schreibt, simonschreibt.de ↩
-
“GPU Profiling”, Unreal Engine documentation, docs.unrealengine.com ↩